
Deer Movement Chart: How to Use Trail Camera Timestamps to Predict Movement
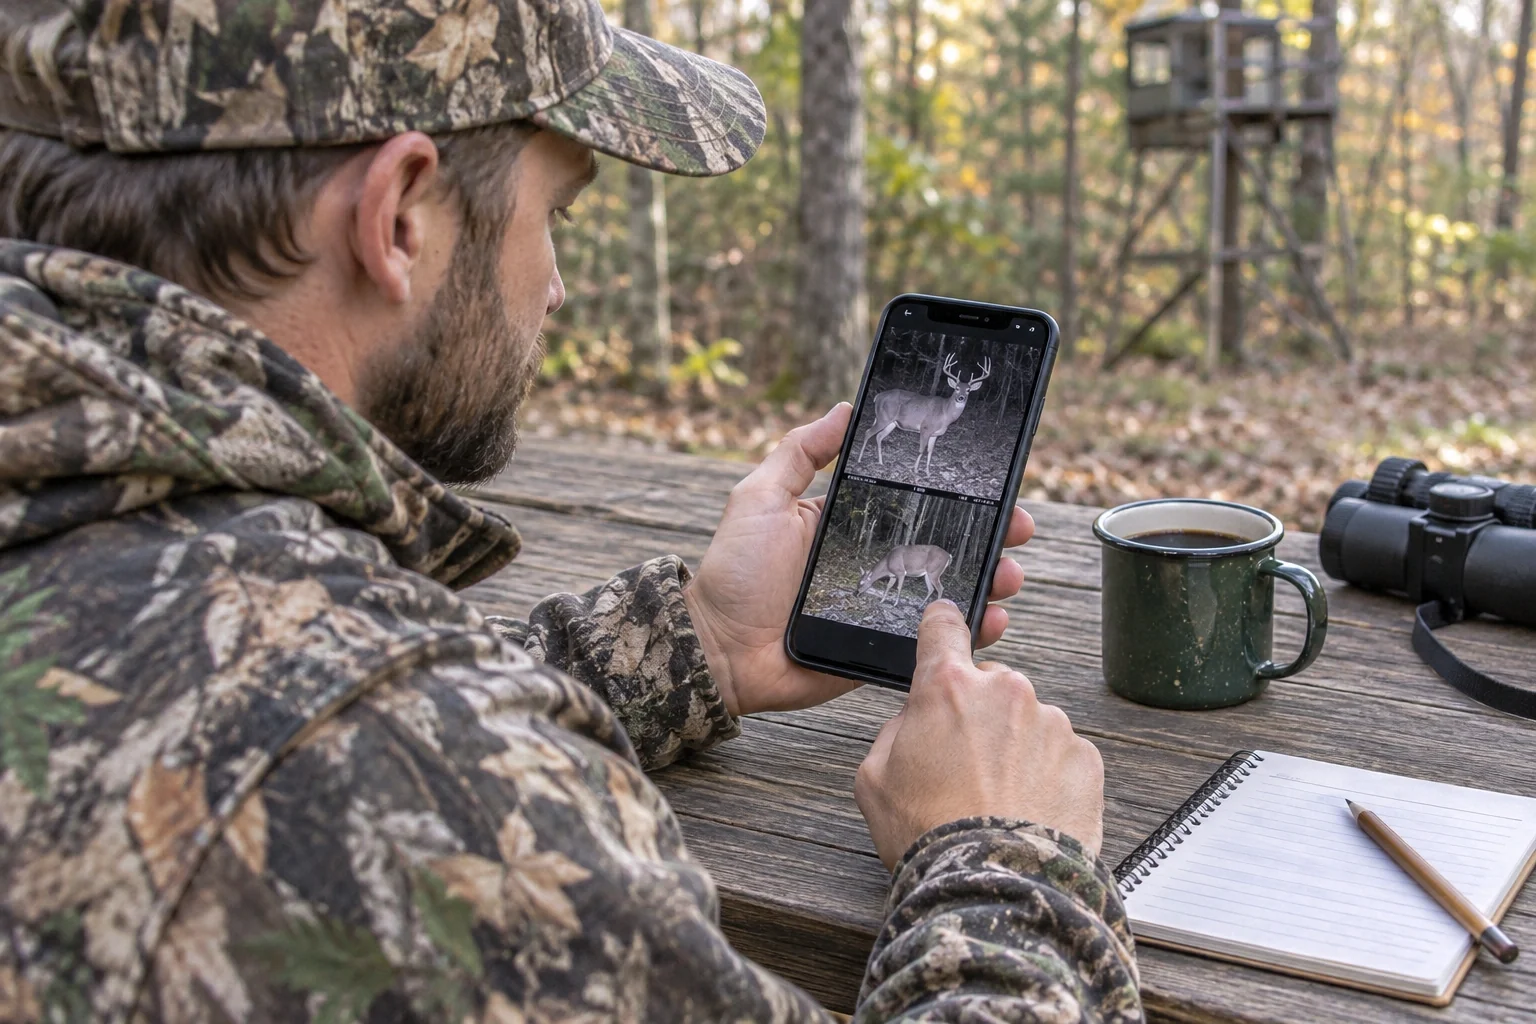
Search for “deer movement today” and you will find plenty of apps and calendars that rate each day based on the moon. They are fun to look at, but they know nothing about the deer on your land. Your trail cameras do. Every photo has a time and date stamp, and with a few weeks of data you can build a deer movement chart that shows when deer actually move where you hunt, not on average across the whole country.
Yes, your own trail camera photos can predict deer movement. For every photo, write down the date, time, camera spot, type of deer and direction of travel, then add the wind, temperature and moon for that day. Sort the sightings into one-hour blocks for each camera. After 2–4 weeks, the busiest hours and best weather for each spot show up clearly. Hunt the camera spots with the most daylight activity, in the hours they peak, on days with similar weather.
- Data you need
- 2–4 weeks of photos per camera
- Log for each photo
- Date, time, camera, deer, direction
- Add for each day
- Wind, temperature, pressure, moon
- Group by
- One-hour blocks per camera
- Most active times
- Usually the hour around sunrise and sunset
- Best tool
- A free spreadsheet (Google Sheets or Excel)
Why Your Own Camera Data Beats a Generic Movement Chart
Generic deer movement charts and “predictor” apps are built mostly on moon phase and moon position, sometimes with weather. Research on GPS-collared deer has found that the moon has only a small effect on movement compared to things like daylight, the rut, temperature and hunting pressure. A chart that does not know where the deer on your property bed, eat and travel cannot tell you which stand to sit in.
Your trail cameras know exactly that. They show:
- When deer pass each spot, to the minute.
- Which deer: does, young bucks, or a buck you want to hunt.
- Which way they were going, which hints at where they bed.
- How patterns change as the season moves from early fall to the rut and late season.
Deer are most active around dawn and dusk. They are not truly nocturnal, but pressured deer move more at night. If your camera shows mostly night photos, that is useful too. Read more in our guide to whether deer are nocturnal.
Step 1: Record Your Trail Camera Timestamps
First, make sure the data is right. Set the correct date and time on every camera, and check it again after you change batteries, because some cameras reset. Turn on the info strip (time, date, temperature and moon) at the bottom of each photo.
Then, each time you pull a card or check your cellular app, log every deer photo in a spreadsheet. Use one row per deer event (count a group arriving together as one event). Use these columns:
| Date | Time | Camera | Deer | Direction | Wind | Temp (°F) | Notes |
|---|---|---|---|---|---|---|---|
| Nov 3 | 6:52 AM | Creek funnel | 8-pt buck | N → bedding | NW 8 mph | 31 | Cold front |
| Nov 3 | 5:18 PM | Oak flat | 3 does | S → food | NW 6 mph | 42 | |
| Nov 4 | 9:40 PM | Field scrape | Unknown buck | E | S 12 mph | 50 | Warm night |
Most cellular trail camera apps can export photo data or at least show it sorted by time, which saves a lot of typing. See how to track animals with a trail camera for more on naming and organizing camera spots.
Step 2: Build a Simple Deer Movement Chart
Once you have 2–4 weeks of rows, turn them into a chart:
- Add an “Hour” column that rounds each time down to the hour (in Google Sheets or Excel, use
=HOUR(B2)). - Make a pivot table with Hour down the side, Camera across the top, and a count of deer events in the middle.
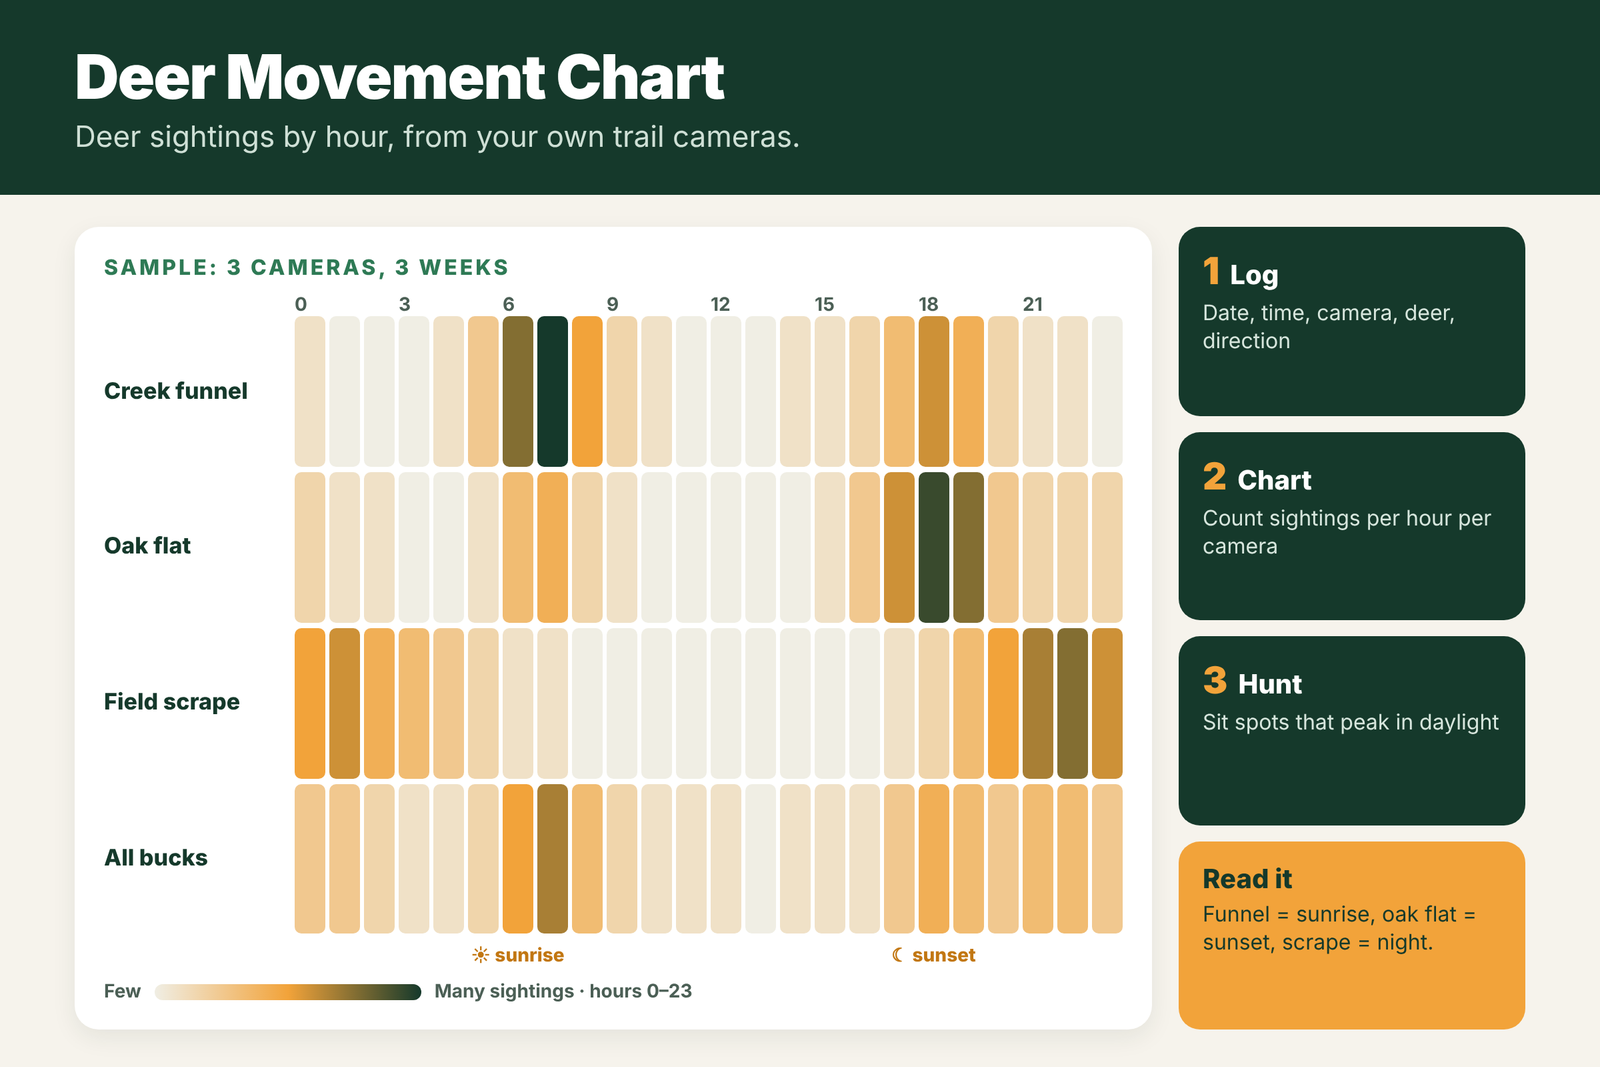
- Color the cells with conditional formatting (light for few sightings, dark for many). This gives you a heatmap of when each spot is busiest.
- Make a second view for bucks only, because does and bucks often move at different times.
Here is what a typical result looks like: a funnel near bedding that gets most of its buck traffic in the first hour after sunrise, a food plot that only lights up in the last 30 minutes of light, and a scrape that is busy only after dark. Those three spots need three different plans.
Step 3: Add Temperature, Wind and Pressure
Time of day is only half the story. Weather changes how much deer move in daylight. Add the weather for each day (most weather apps and sites show past hourly weather) and look for links like these:
- Temperature drops: a day that is 10°F or more colder than the days before it often brings more daylight movement, especially in the rut and late season.
- Wind: deer often move less in very strong wind. Note the wind direction too, because it tells you which stand you can hunt without being smelled.
- Barometric pressure: many hunters see more movement when pressure is rising after a front. Log it and see if it holds on your land.
- Moon: log it if you want to test it. On many properties it will not show a strong pattern.
After a season or two, you might find something like “my creek funnel gets daylight buck traffic on cold mornings with a north wind.” That is far more useful than any generic rating.
Step 4: Turn the Chart Into a Hunt Plan
- Pick spots with daylight activity. A camera that only shows deer at 2 a.m. is a place to learn from, not a place to sit. Move your stand back toward bedding until the times fall in shooting light.
- Match your sit to the peak hours. If a stand peaks at 7–8 a.m., be in it well before first light and stay until 9 or 10.
- Hunt the right weather. Save your best stand for days that match its best conditions, such as the first cold morning after a warm spell.
- Watch the season shift. Patterns change fast in the rut. Keep updating the chart and move cameras with the deer, as in our trail camera strategy for the rut.
Want to know the general best times to see deer before you have your own data? Start with our guide on the best time to see deer.
Free Deer Movement Chart Template
You do not need special software. Copy this layout into Google Sheets or Excel:
- Sheet 1 “Log”: Date | Time | Hour (=HOUR(Time)) | Camera | Deer (doe/buck/name) | Direction | Wind dir | Wind mph | Temp °F | Pressure | Moon | Notes
- Sheet 2 “Chart”: pivot table of Log with Hour as rows, Camera as columns, count of Deer as values, plus color scale formatting.
- Sheet 3 “Bucks”: the same pivot table filtered to bucks only.
Update it every time you check your cameras. It takes five minutes, and after a few weeks it will tell you more than any app.
Frequently Asked Questions
Can trail camera photos predict deer movement?
Yes. When you log the time, place and weather of each deer photo for 2 to 4 weeks, clear patterns show up for each camera spot, such as the hours and weather when bucks pass in daylight.
What time do deer move the most?
Deer move most in the hour or two around sunrise and sunset. During the rut, bucks can move at any time of day, and pressured deer move more at night.
Are deer movement apps and calendars accurate?
Most are based mainly on the moon, which research shows has only a small effect on deer movement. Your own trail camera data is a better guide for your hunting spots.
How much trail camera data do I need to make a movement chart?
Two to four weeks of photos per camera is enough to see basic patterns. More data, especially across different weather, makes the chart more reliable.
Does weather affect deer movement?
Yes. A sharp drop in temperature often increases daylight movement, very strong wind can reduce it, and many hunters see more movement on rising pressure after a front.